

Now you can see our Carbon Footprint for each product!
¡Now you can see our carbon footprint!
WHY IS IT IMPORTANT TO MEASURE IT?
In short; so you can make more informed choices.
But mostly because we can’t improve what we don’t measure, so we did a Life Cycle Analysis (LCA) to understand the carbon footprint, global warming potential and other impacts our products are leaving on our planet. This way we can understand our environmental inefficiencies and we can work on them to lower our footprint.
We aim to reduce to half our emissions by 2025.
WHAT ARE WE MEASURING?
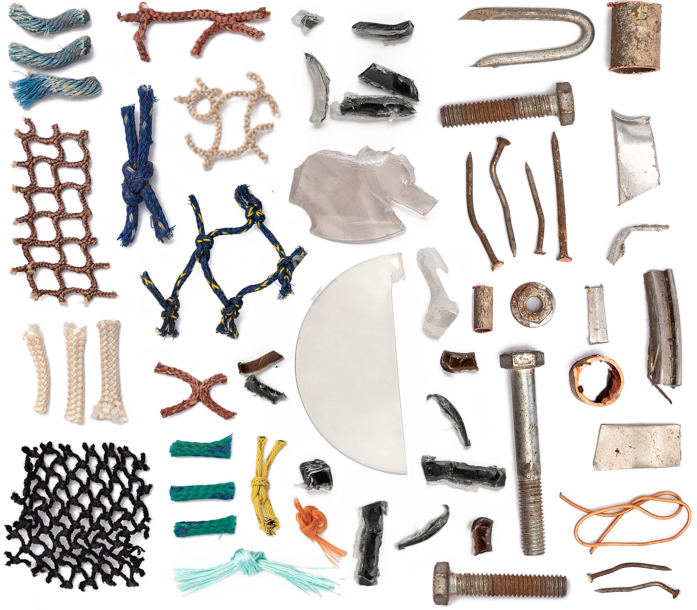
Every process from raw materials (which in our case are from recycled sources), to the production of the final frame, lenses, cases, cardboard packaging and transportation towards one distribution center in Europe.
Main results:
Average KGCO2e/final product =
1.69
KG CO2e
WHAT WE COULDN´T MEASURE
The last mile from this distribution center to our warehouses and then to the final customer it’s not included in this measurement due to difficulties in projecting this data prior to the demand, but we aim to include it in the next measurement.

LO QUE NO PUDIMOS MEDIR
WHAT WE COULDN´T MEASURE
The last mile from this distribution center to our warehouses and then to the final customer it’s not included in this measurement due to difficulties in projecting this data prior to the demand, but we aim to include it in the next measurement.
IS IT USEFUL?
A number by itself doesn’t mean much, but inspired by Oatly and their “Together for climate labelling” initiative, we want to set an example in the eyewear industry and call on other players to open their numbers. Since our 1,69 Average KGCO2e/final product doesn't mean much by itself, we need to compare it with other numbers.
This way we can compare and hopefully share practices that can help us all progress in the trace we are leaving on our planet.
In the meantime here are some examples of other products (and brands that we love!) as reference.

3.72
KG CO2e Conventional eyewear

10
KG CO2e Average shoe
Allbirds

14.1
KG CO2e Average shoe
5.5
KG CO2e Polyester shirt

0.51
KG CO2e Oatly Oat Milk Barista Version

3.2
KG CO2e Cows Milk
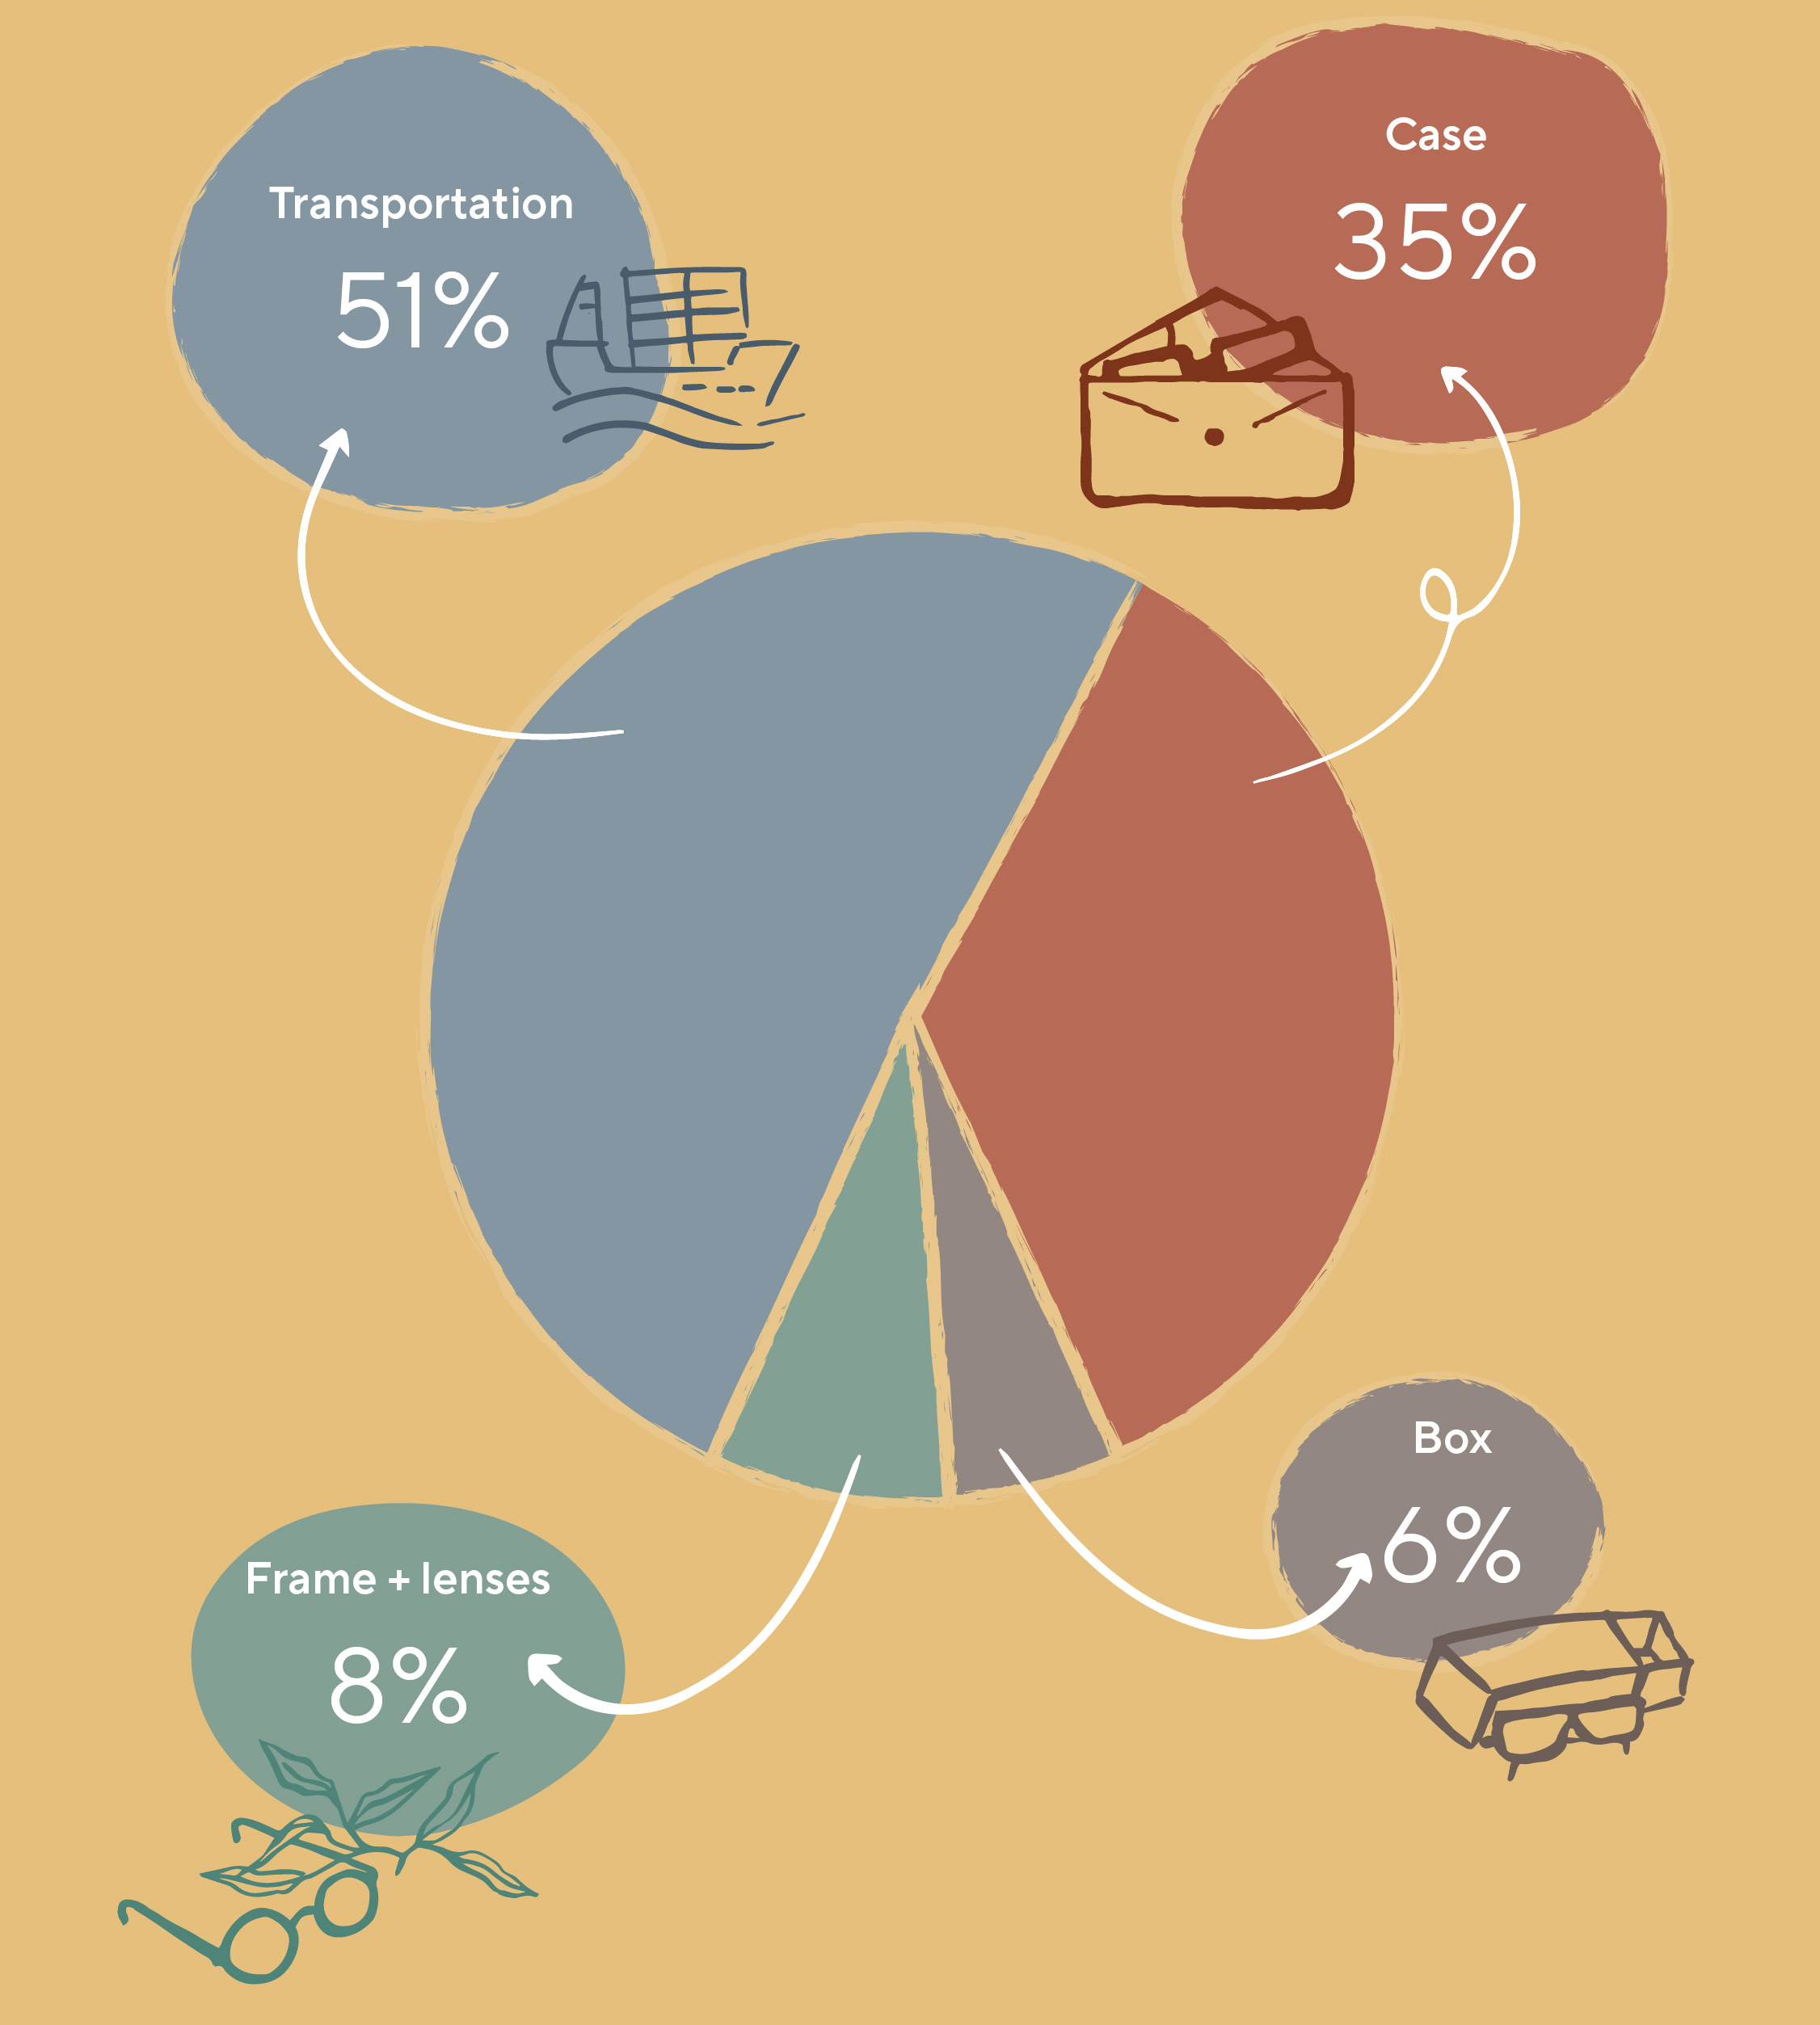
WELL...
so the main differences in carbon footprint between our products are the compositions of raw materials inside the frames. .
We found 3 main groups:

1,59
KG CO2e
Recycled metals and Econyl regenerated nylon®:
All products made out of 100% metal, 100% Econyl® or a combination of both materials have the lowest carbon footprint.
1,67
KG CO2e
Recycled polycarbonate combined:
All products made with polycarbonate combined with metal or Econyl Nylon (or both) have a medium carbon footprint.

1,82
KG CO2e
Recycled polycarbonate
alone:
alone:
All products made only with recycled polycarbonate have the highest carbon footprint.
The numbers are estimates that may have a variation of +/- 10%
IMPORTANT TO CONSIDER
The numbers, similar to nature, will change because we will be working on improving and updating the information behind our footprint. The most recent data will be found on The Nest, since updating printed numbers takes a bit longer.
If you feel like we´re being a bit vague you can read more here
Even though we carpool…
AIR TRANSPORT:
Routes of over 3,700 km (long flights):
For every kilometer traveled per ton, from an initial point of origin to a final destination,1.26 Kg of CO2e are emitted.
Routes of less than 3,700 km (short or domestic flights):
For every kilometer traveled per ton, from an initial point of origin to a final destination,1.13 Kg of CO2e are emitted.
LAND TRANSPORT:
Diesel trucks whose capacity varies between 3.5 and 7 tons, 0.26 Kilos Of Carbon Dioxide equivalent are generated.
SEA TRANSPORT:
Finally, sea transportation has the least environmental effect on the greenhouse gas inventory , so for every ton-kilometer 0.01 Kg of CO2e are emitted.
Karün distribution per units by means of transport in 2021